klynch/skyline repository overview
Skyline

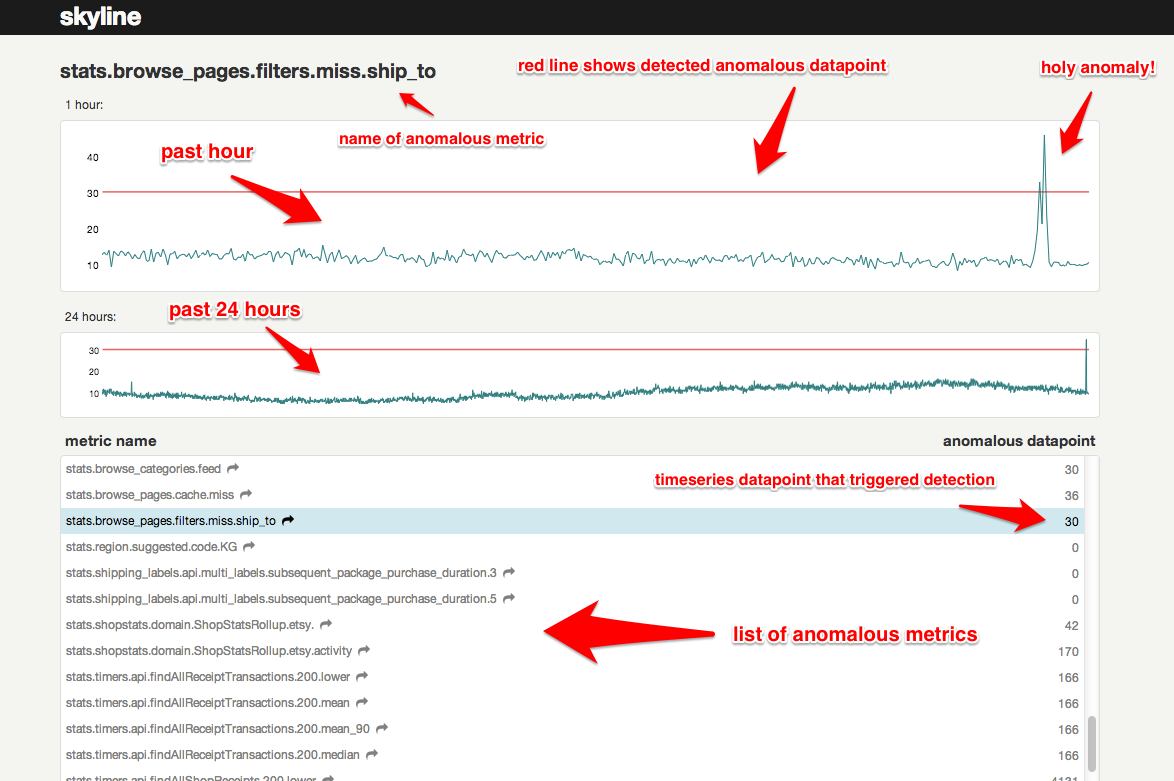
Skyline is a real-time* anomaly detection* system*, built to enable passive monitoring of hundreds of thousands of metrics, without the need to configure a model/thresholds for each one, as you might do with Nagios. It is designed to be used wherever there are a large quantity of high-resolution timeseries which need constant monitoring. Once a metrics stream is set up (from StatsD or Graphite or other source), additional metrics are automatically added to Skyline for analysis. Skyline's easily extendible algorithms automatically detect what it means for each metric to be anomalous. After Skyline detects an anomalous metric, it surfaces the entire timeseries to the webapp, where the anomaly can be viewed and acted upon.
Read the details in the wiki.
Install
-
Download and install the latest Redis release
-
Install
numpyandscipyindependently viapipfollowed by the rest of the requirements. Dependency resolution inpipdoes not allow the to be installed in the requirements file (SciPy depends on NumPy in an odd way). The solution is to install these two explicitly.pip install numpy pip install scipy pip install -r requirements.txt -
You may have trouble with SciPy. If you're on a Mac, try:
sudo port install gcc48sudo ln -s /opt/local/bin/gfortran-mp-4.8 /opt/local/bin/gfortransudo pip install scipy
On Debian, apt-get works well for Numpy and SciPy. On Centos, yum should do the trick. If not, hit the Googles, yo.
By default, the webapp is served on port 1500.
- Check the log files to ensure things are running.
Debian + Vagrant specific, if you prefer
Hey! Nothing's happening!
Of course not. You've got no data! For a quick and easy test of what you've got, run this:
python ./skyline.py settings -i data/settings.json
python ./skyline.py horizon -l 2023 -u 2025
python ./skyline.py seed -l 2023 -u 2025 -d data/data.json
python ./skyline.py analyzer
This will ensure that the Horizon service is properly set up and can receive data. For real data, you have some options - see wiki
Once you get real data flowing through your system, the Analyzer will be able start analyzing for anomalies! But be
aware, analyzer it will only start to really analyzing timeseries when redis has FULL_DURATION (e.g. 86400 seconds)
worth of data, otherwise it is too short aka less than MIN_TOLERABLE_LENGTH.
Metric Filtering
A BlackList and a WhiteList is used to filter out unwanted metrics similar to the filters in graphite. Many metrics, especially aggregate metrics, do not convey any additional information and result in unnecessary load on the system. Each entry in the blacklist and whitelist is a regex, which behaves much like the graphite/carbon RegexList. The Listener will check to see if each # incoming metric is not in the blacklist and in the whitelist. If a list is empty, all entries will pass through it.
Metrics are rejected if skyline:config:blacklist is defined in Redis and non-empty, and the metric matches at least 1
of the regular expression patterns in that list. To reject all metrics the pattern .* can be used.
Metrics are rejected if skyline:config:whitelist is defined in Redis and non-empty, and the metric does not match at
least 1 of the regular expression patterns in that list. To accept all metrics the pattern .* can be used, or the list
can be empty.
"skyline:config:blacklist": [
    "^skyline\."
    "^example\.statsd\.metric$",
    "^another\.example\..*",
    "_90$",
    "\.lower$",
    "\.upper$",
    "\.median$",
    "\.count_ps$",
    "\.sum$",
]

"skyline:config:whitelist": []
Alerts
Skyline can alert you! Add any alerts you want to the ALERTS parameter stored in Redis, according to the schema (metric pattern, strategy, expiration timeout seconds, strategy arguments) where strategy is one of smtp, hipchat,
pagerduty, syslog, or stdout. Wildcards can be used in the metric keyword as well. You can also add your own
alerting strategies. For every anomalous metric, Skyline will search for the given keyword and trigger the
corresponding alert(s). To prevent alert fatigue, Skyline will only alert once every for any given
metric/strategy combination. To enable Hipchat integration, uncomment the python-simple-hipchat line in the
requirements.txt file. If using syslog then the EXPIRATION_TIME should be set to 1 for this to be effective in
catching every anomaly, e.g. ("stats", "syslog", 1, {})
This is the config for which metrics to alert on and which strategy to use for each. Alerts will not fire twice within
timeout period, even if they trigger again. This is stored as JSON data in the Redis key
skyline:config:alerts:rules with the following schema:
Schema: [
           [pattern, strategy, timeout, arguments],
        ]
where pattern is a regular expression string, alert is an identifier for the alert, expiration timeout is the time the alert/metric pair is quiet for, and arguments is an alert specific dictionary.
"skyline:config:alerts:rules": [
    [".*",      "stdout",    1800, {}],
    ["skyline", "smtp",      1800, { "recipients": ["[email protected]"] }],
    ["metric1", "hipchat",   1800, { "rooms": [12345] }],
    ["metric2", "pagerduty", 1800, { "rooms": [12345] }],
]
General alert settings are stored as a JSON blob in the Redis key skyline:config:alerts:settings.
"skyline:config:alerts:settings": {
    #This specifies the mailserver to connect to. If user or password are blank no authentication is used.
    "smtp": {
        "host": "127.0.0.1:25",
        "user": "skyline",
        "password": "",
        "sender": "[email protected]",
    },

    # HipChat alerts require python-simple-hipchat
    # Background color is one of "yellow", "red", "green", "purple", "gray", or "random"
    "hipchat": {
        "auth_token": "pagerduty_auth_token",
        "color": "purple",
    },

    # PagerDuty alerts require pygerduty
    # Requires pagerduty subdomain and auth token and Service API key (shown on the detail page of a "Generic API" service)
    "pagerduty": {
        "subdomain": "example",
        "auth_token": "your_pagerduty_auth_token",
        "key": "your_pagerduty_service_api_key",
    },
}
Graphite
To send Skyline metric data back into Graphite, or to link to Graphite (or another graphite dashboard) graphs directly,
set the skyline:config:graphite key with the following JSON data in Redis:
 {
      "host": "graphite.squarespace.net",
	  "port": 2003,
	  "url": "http://graphite.squarespace.net/render/?width=1400&from=-1hour&target=%s"
 }
The host and port fields will be used to for live metrics to Graphite. The url field will be used for image links
where %s will be replaced by the metric name.
How do you actually detect anomalies?
An ensemble of algorithms vote. Majority rules. Batteries kind of included. See wiki
Architecture
See the rest of the wiki
Contributions
- Clone your fork
- Hack away
- If you are adding new functionality, document it in the README or wiki
- If necessary, rebase your commits into logical chunks, without errors
- Verfiy your code by running the test suite and pep8, adding additional tests if able.
- Push the branch up to GitHub
- Send a pull request to the project.
We actively welcome contributions. If you don't know where to start, try checking out the issue list and fixing up the place. Or, you can add an algorithm - a goal of this project is to have a very robust set of algorithms to choose from.
Also, feel free to join the skyline-dev mailing list for support and discussions of new features.
(*depending on your data throughput, *you might need to write your own algorithms to handle your exact data, *it runs on one box)
Tag summary
Content type
Image
Digest
sha256:d867b4ba6…
Size
405.7 MB
Last updated
almost 11 years ago
docker pull klynch/skyline