obeoneorg/sys-stats
Real-time system monitoring tool with web & CLI interfaces, Docker support, and Ollama integration.
5.8K
obeoneorg/sys-stats repository overview
📊 sys-stats




Real-time system, GPU and Ollama monitoring for a single machine, with a web dashboard, a terminal dashboard, and a compact JSON endpoint for an embedded wall display.
One process collects everything (CPU, RAM, swap, load, per-core usage, temperatures, fans, NVIDIA GPUs, per-process CPU/RAM/VRAM, loaded Ollama models) in a background sampler and serves it over HTTP. Every dashboard is a client of that API, not a second collector, so you can watch a remote host from your laptop, from a browser or from a terminal.
🚀 Features
| Feature | What it does |
|---|---|
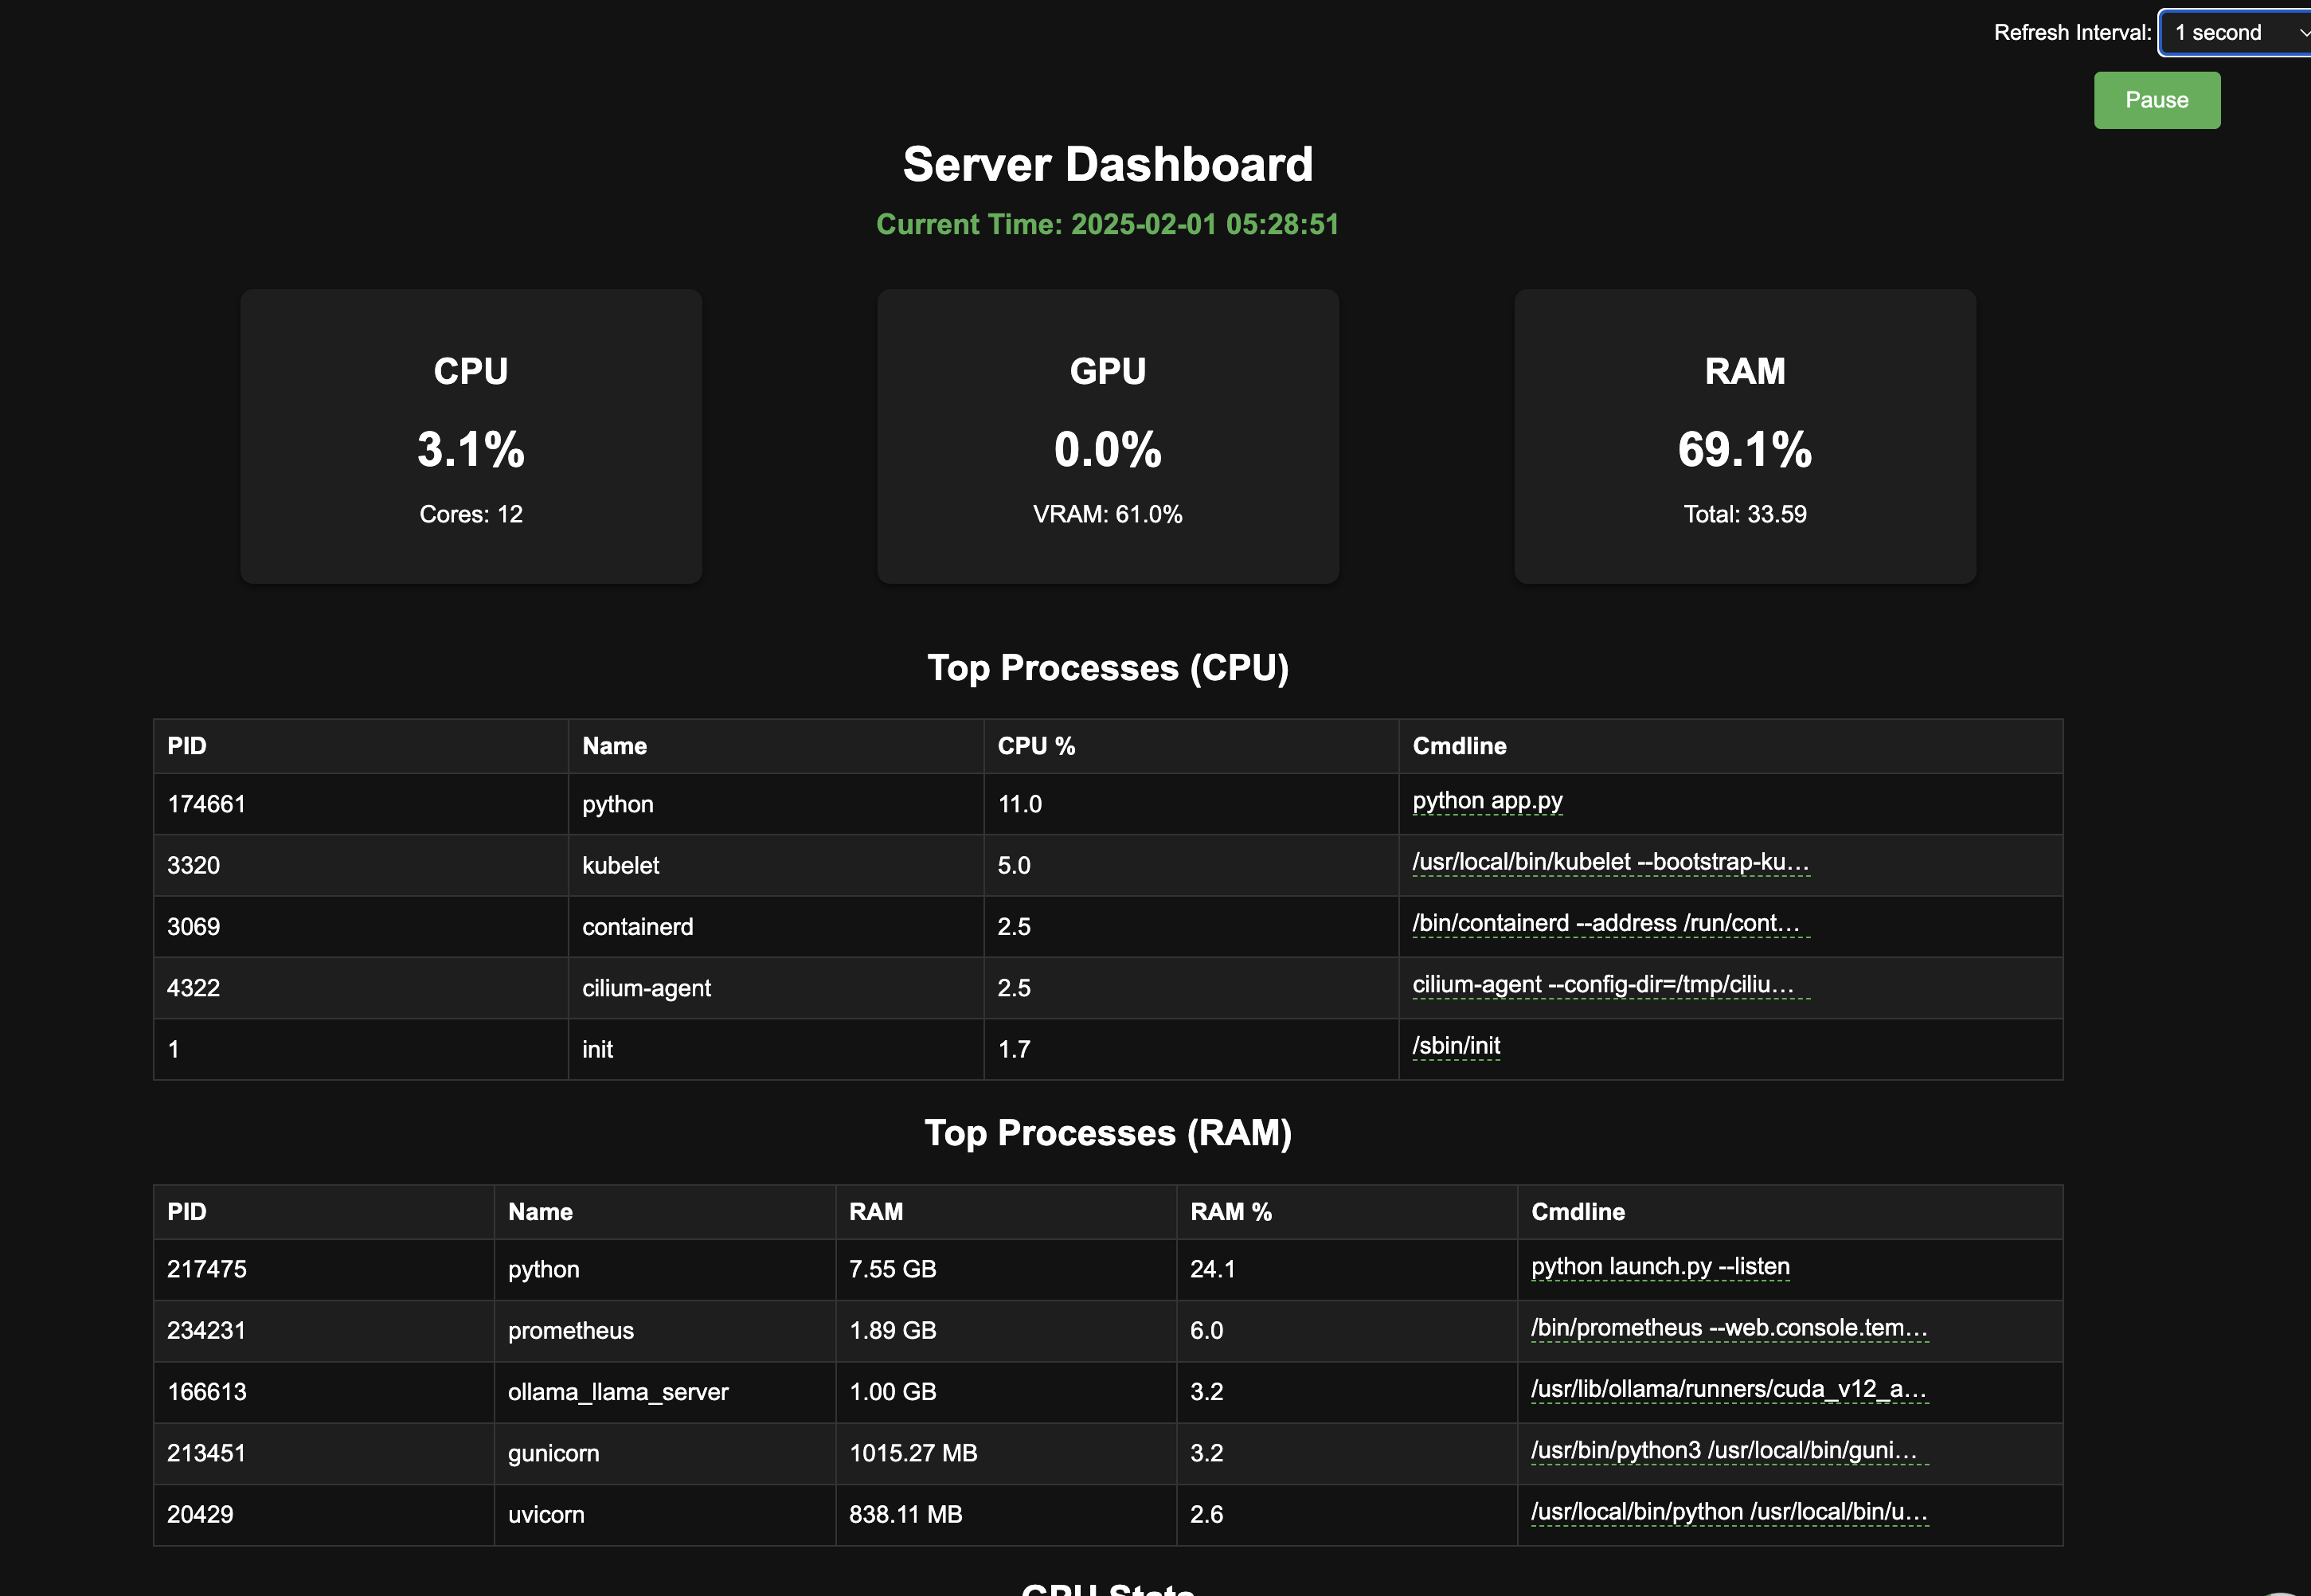
| 🖥️ Web dashboard | Auto-refreshing UI at /, no build step and no JS dependencies |
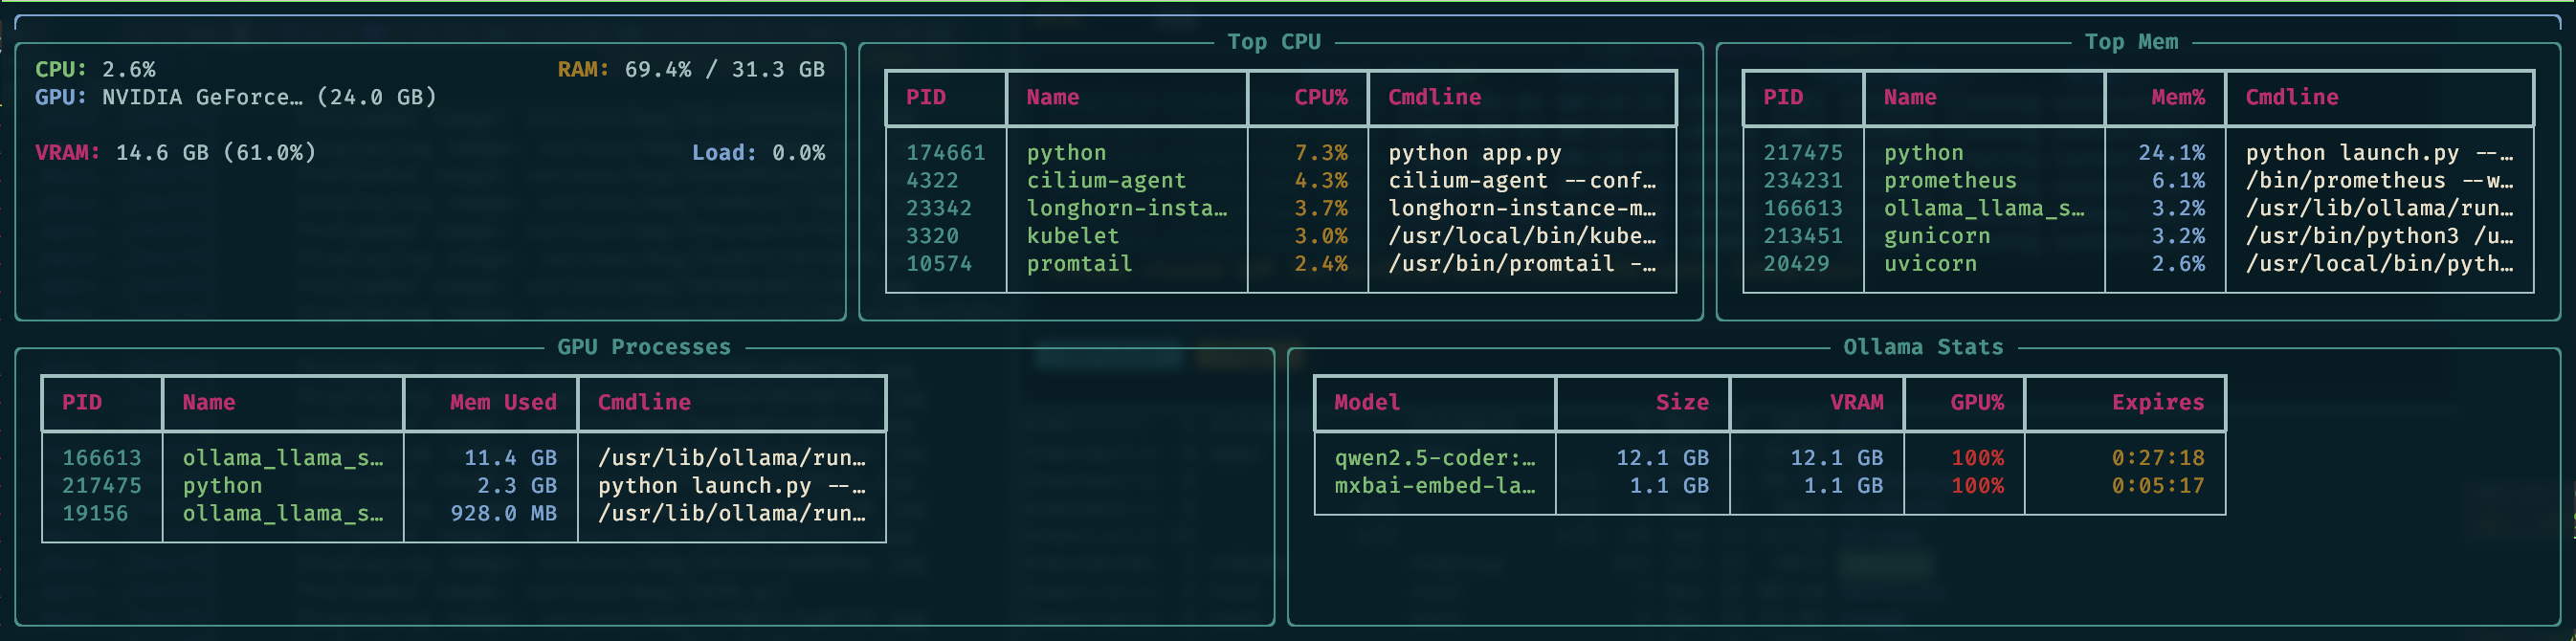
| 📺 Terminal dashboard | Rich TUI with focus, zoom, scrolling and adjustable refresh |
| 🎮 GPU monitoring | Load, VRAM, temperature, fan speed, power draw, per-process VRAM |
| 🤖 Ollama integration | Loaded models with their VRAM footprint and context window |
| 🌡️ Sensors | hwmon temperatures and fans, plus IPMI sensors on chassis with a BMC |
| 📟 Embedded panel | /panel, a frozen-schema payload sized for an ESP32-S3 wall display |
| 🐳 Deployment | Multi-arch image, Compose overlays, and a Helm chart for Kubernetes |
⚡ Quickstart
docker run -d --pid=host -p 5000:5000 ghcr.io/obeone/sys-stats:1.5.0
Open http://localhost:5000.
--pid=host is what makes the process tables meaningful. Without it the
container sees exactly one process, its own. No privileged flag is needed.
On macOS, port 5000 belongs to the AirPlay Receiver. Publish on another port
(-p 5051:5000) or turn AirPlay off.
🖼️ Screenshots
📦 Installation
Two console scripts come with the package, whichever way you install it:
| Command | Purpose |
|---|---|
sys-stats-server | Flask metrics API and web UI, serves /, /stats and /panel |
sys-stats | Rich terminal dashboard, an HTTP client of /stats |
python -m sys_stats is an alias for the CLI.
With uv (recommended)
uv is the fastest option and keeps the tool in
its own environment:
uv tool install git+https://github.com/obeone/sys-stats.git
Upgrade with uv tool upgrade sys-stats, remove with
uv tool uninstall sys-stats. To run it once without installing anything
permanent:
uvx --from git+https://github.com/obeone/sys-stats.git sys-stats
With pipx
pipx install git+https://github.com/obeone/sys-stats.git
Upgrade with pipx upgrade sys-stats, remove with pipx uninstall sys-stats.
With pip
⚠️ Do not run
pip install sys-stats. That name belongs to a different, unrelated project on PyPI, which also describes itself as serving system stats over a web interface, so installing it by mistake looks like success. This project is not published on PyPI under any name. Install it from git or from a checkout.
python3 -m venv .venv
source .venv/bin/activate          # Windows: .venv\Scripts\activate
pip install git+https://github.com/obeone/sys-stats.git
From a local checkout, for development
git clone https://github.com/obeone/sys-stats.git
cd sys-stats
uv venv && source .venv/bin/activate
uv pip install -e '.[dev]'
🐳 Docker
git clone https://github.com/obeone/sys-stats.git
cd sys-stats
docker compose up -d
Overlays layer on top of compose.yaml for hardware the default cannot reach:
| Command | When |
|---|---|
docker compose up -d | Any host. CPU, RAM, processes, hwmon sensors |
docker compose -f compose.yaml -f compose.gpu.yaml up -d | NVIDIA GPU, through the NVIDIA container runtime |
docker compose -f compose.yaml -f compose.ipmi.yaml up -d | Server with a BMC (Supermicro, Dell) for IPMI sensors |
Images are published on every release to ghcr.io/obeone/sys-stats and
docker.io/obeoneorg/sys-stats, for linux/amd64 and linux/arm64, and
signed with cosign.
What the container needs, and what it does not
The container runs unprivileged, as UID 10001, and that is enough for everything except IPMI:
| Collector | Requirement |
|---|---|
| Processes, CPU, RAM, swap, load | pid: host. /proc is world-readable |
| hwmon temperatures and fans | Nothing. /sys is already mounted read-only |
| NVIDIA GPU | The NVIDIA container runtime, via compose.gpu.yaml |
| IPMI temperatures and fans | /dev/ipmi0 mapped in, and root to open it |
/dev/ipmi0 is root:root 0600 on every distribution that ships it, so
compose.ipmi.yaml runs as root. Where host udev rules give the device a
group, prefer group_add with that GID and keep the unprivileged user; the
overlay documents both.
☸️ Kubernetes
chart/ is a Helm chart built on the
bjw-s common library:
helm dependency update chart/
helm upgrade --install sys-stats ./chart --namespace monitoring --create-namespace
The dashboard reports on the node the pod lands on, so the chart defaults to
hostPID: true, without which the process tables are empty. The container
itself runs unprivileged, with capabilities.drop: [ALL].
Pin the pod to the machine you actually want to watch, claim a GPU if you want
the NVIDIA panels, and point OLLAMA_API_URL somewhere for the Ollama one.
chart/values.yaml documents all three, along with the
commented block for IPMI, which does need a privileged pod on Kubernetes since
there is no per-device request for a BMC.
⚙️ Configuration
Everything is an environment variable. Nothing is required.
Server
| Variable | Default | Effect |
|---|---|---|
HOST / PORT | 0.0.0.0:5000 | Bind address |
FLASK_DEBUG | false | true enables Flask debug mode |
OLLAMA_API_URL | unset | Enables the Ollama panel; unset means an empty model list, never an error |
SYS_STATS_INSTANCE_LABEL | unset | Free-text label in the web UI title and body |
SYS_STATS_PANEL_ONLY | unset | 1/true/yes registers only /panel |
Sampler
| Variable | Default | Effect |
|---|---|---|
SYS_STATS_SAMPLE_INTERVAL | 2.0 | Seconds between samples |
SYS_STATS_TOP_PROCESSES_MAX | 50 | Cap per per-process ranking |
SYS_STATS_IPMI_INTERVAL | 30.0 | Seconds between ipmitool polls |
SYS_STATS_DCGM_URL | unset | Scrape /panel's GPUs from dcgm-exporter |
SYS_STATS_AUTOSTART | on | 0/false/no skips the sampler autostart |
Panel
| Variable | Default | Effect |
|---|---|---|
SYS_STATS_HOSTNAME | real hostname | Overrides /panel's host field |
SYS_STATS_PANEL_MAX_TEMPS | no cap | Truncates /panel's temps list |
SYS_STATS_PANEL_MAX_FANS | no cap | Truncates /panel's fans list |
SYS_STATS_PANEL_MAX_GPUS | no cap | Truncates /panel's gpu list |
CLI
| Variable | Default | Effect |
|---|---|---|
SYS_STATS_API_URL | http://localhost:5000/stats | Default --url |
The ones with a real story behind them
SYS_STATS_PANEL_ONLY is security-relevant. /stats exposes the full
host process table, complete command lines included, with no authentication.
Set this and /, /stats and /favicon.png are never registered at all, so
a request gets Flask's own 404 rather than a guarded rejection. On a host
whose network you do not fully trust, and where the consumer only ever needs
/panel, removing the route beats guarding it. The Helm chart's default
probes hit /, so enabling this there means repointing them at /panel.
SYS_STATS_HOSTNAME and SYS_STATS_INSTANCE_LABEL are not the same thing
and are never merged. The label is display prose, meant to be rewritten for
readability, for telling apart two instances describing the same physical box
(a Kubernetes pod seeing the Talos VM, and a second instance on the Proxmox
hypervisor underneath). The hostname is a machine identity a consumer compares
byte for byte, /panel only, and otherwise read fresh on every request so a
runtime rename takes effect without a restart.
SYS_STATS_DCGM_URL is for a host with no NVIDIA driver of its own, such
as a Proxmox hypervisor whose GPUs are PCI-passed-through to a Kubernetes VM
where dcgm-exporter runs instead.
It is scraped in the same sampling pass as everything else, behind a circuit
breaker, so a dead or firewalled endpoint degrades to an empty gpu[] with a
"gpu" tag in err rather than stalling the sampler. /stats never reads
it and always stays on the GPUtil path.
SYS_STATS_IPMI_INTERVAL is decoupled from the sample interval because
chassis fan speed and temperature move on a timescale of tens of seconds, and
each poll costs a BMC round trip. Between polls the lists keep serving the
last IPMI reading rather than dropping it; the first pass after startup always
polls immediately. hwmon sensors keep the normal per-pass cadence.
📺 Using the terminal dashboard
sys-stats --url http://localhost:5000/stats --interval 5
Every panel carries a number in its title, and a one line key helper is pinned
at the bottom. Press h for the full list.
| Key | Action |
|---|---|
q / r | Quit, force a refresh |
p / - / + | Pause, slow down, speed up |
1..9 | Focus the panel carrying that number |
Tab / Shift+Tab | Focus the next or previous panel |
Enter / Esc | Zoom the focused panel full screen, and come back |
arrows, PgUp/PgDn, Home/End | Scroll the focused panel |
A panel that cannot show every row says how many it is hiding, so a busy host never drops rows silently. A zoomed panel keeps refreshing and keeps scrolling.
The layout follows the terminal: a wide one gets a row of columns, a narrower one falls back to a grid, and panels stop where their content stops instead of framing empty space. On a machine with several GPUs the summary keeps cumulated figures, each card gets its own detail table (or one row per card when they no longer fit side by side), and the GPU process list says which card each process is holding VRAM on.
🔌 API
| Route | Returns |
|---|---|
GET / | The web dashboard |
GET /stats | Full JSON payload: CPU, RAM, GPUs, top processes, Ollama models |
GET /panel | Compact frozen-schema payload for an embedded display |
GET /favicon.png | Icon |
/stats takes an optional ?limit= for the per-process rankings, capped by
SYS_STATS_TOP_PROCESSES_MAX.
/panel carries no process lists and no Ollama data, just CPU, RAM, swap, GPU
and sensor numbers, plus an age in seconds telling the display how stale the
sample is. It shares the same sampling pass as /stats, so enabling it costs
no extra nvidia-smi call. Its schema is frozen on purpose: a wall display
flashed once should not need reflashing when the dashboard gains a field.
Both routes read a cached snapshot. No request ever collects anything itself.
🛠️ Development
uv venv && source .venv/bin/activate
uv pip install -e '.[dev]'
| Command | Purpose |
|---|---|
pytest | Whole suite |
pytest tests/test_stats_endpoint.py | One file |
pytest -k gpu_processes | One test or group |
ruff check . | Lint, add --fix to autofix |
uv build | Wheel and sdist in dist/ |
docker compose up -d --build | Rebuild the image and restart |
No test touches the real machine: psutil, GPUtil, subprocess.run and
requests.get are all monkeypatched at the sys_stats.collectors boundary.
The version lives in git tags and nowhere else: hatch-vcs derives it, so a build
on v1.6.0 is 1.6.0 and three commits later it is 1.6.1.dev3+g<sha>. A tree
with no tags in it, a shallow clone or an unpacked source tarball, has nothing to
derive from and needs SETUPTOOLS_SCM_PRETEND_VERSION=X.Y.Z to build at all.
Releasing is one push. git tag v1.6.0 && git push origin v1.6.0 runs the tests,
publishes :1.6.0 and :latest to both registries, opens the GitHub release with
its generated changelog, and commits the new image tag into compose.yaml, this
README and the chart.
🏗️ Architecture
flowchart TB
    subgraph host["Host machine"]
        PS["psutil<br/>CPU, RAM, procs, hwmon"]
        NV["nvidia-smi + GPUtil"]
        IP["ipmitool<br/>/dev/ipmi0"]
    end

    subgraph proc["sys-stats-server"]
        SA["Background sampler<br/>one pass every 2s"]
        CA[("Cached snapshot")]
        FL["Flask app"]
    end

    OL["Ollama /api/ps"]
    DC["dcgm-exporter /metrics"]

    PS --> SA
    NV --> SA
    IP --> SA
    OL --> SA
    DC --> SA
    SA --> CA
    CA --> FL

    FL -->|"/"| WEB["Web dashboard"]
    FL -->|"/stats"| CLI["sys-stats TUI"]
    FL -->|"/panel"| ESP["ESP32-S3 wall display"]
Every collector degrades to empty data rather than raising, so a missing GPU, a dead Ollama or a host with no BMC costs you a blank panel, never a 500.
🧑💻 Contributing
Issues, feature suggestions and pull requests are all welcome.
This repo is clearly messy, but it was supposed to be only for my own use!
📝 License
MIT. See LICENSE.
Made by Grégoire Compagnon (obeone)
Tag summary
Content type
Image
Digest
sha256:417e3a37f…
Size
49.6 MB
Last updated
about 5 hours ago
docker pull obeoneorg/sys-stats